Use Case Study: Prometheus Important Metrics On Games Service
Basic Monitoring
CCU

CCU indicates the current users count that playing our games, it's not only the key service status metric but also the key business metric in Games.
Service Protocol (HTTP)
Calculate by the QPS of the regular heartbeat request.
For example, the client send a heartbeat request every 10s, then we can say the service's CCU is 10*QPS (the QPS metric report type is counter in prometheus system, normally, we get the QPS ).
sum(increase(server_handled_total{service="${serviceName}", method="${heartbeatAPIName}",env=~"${env}"}[1m])) by (cid) / 6
Service Protocol (WebSocket)
Stats the established WebSocket connection directly.
sum(websocket_connected_client_count{service="websocket-gateway",upstream=~"${serviceName}",env=~"${env}"}) by (cid)
HTTP Status Code: 5xx

Availability is the core metric of a service, http status code 5.* almost indicates whether the web service available or not.
For the services that have integrated with nginx api-gateway, due to it cannot differentiate the SGW metrics by location, we use the HTTP metric that reported by web service or api-gateway instead of the SGW metrics.
So, for api-gateway upstreams, the promql looks like:
sum(increase(apigateway_handled_total{service="games-apigateway",upstream="${serviceName}",env="$env",status_code=~"5.*"}[1m])) by (cid)
For other services can directly use nginx metrics from it load balancer
sum(increase(nginx_v2_requests_total{host=~"your-domain",status_code=~'5xx',endpoint=~"${location}"}[1m])) by (host,endpoint)
HTTP Status Code: 4xx

Although http status code 4.* is not service code scope, we also need to monitor it because the abnormal wave can help us find some serious bugs, such as 401 for abnormal login status and 403 for wrong anti-fraud strategy.
sum(increase(nginx_v2_requests_total{host=~``"your-domain"``,status_code=~``'4xx'``,endpoint=~``"${location}"``}[1m])) by (host,endpoint) `
Play Time Success Rate
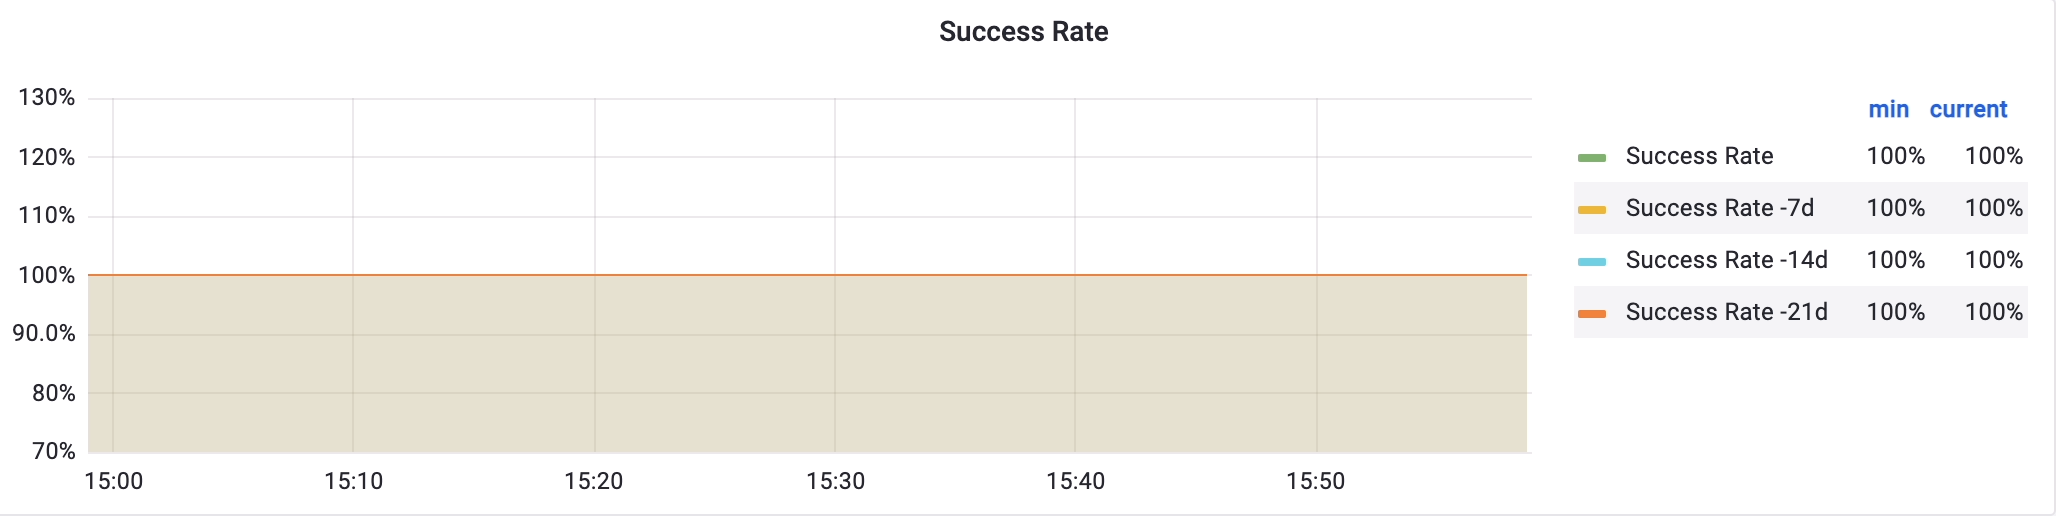
Play time success rate is the key metricin Games. It means we should promise the core function APIs with a high success rate.
100``-sum(job:nginx_requests_total_v2:increase_by_endpoint{host=~``"your-domain.*"``,status_code=~``"5xx"``, endpoint=~``"${location}"``})by(host,endpoint)/sum(job:nginx_requests_total_v2:increase_by_endpoint{host=~``"your-domain.*"``, endpoint=~``"${location}"``})by(host,endpoint)*``100
API Latency
We should not only concern the average latency, should also take care of the P90, P95.
quantile(``0.50``, (job:nginx_request_latency_seconds_v2:avg_by_endpoint{host=~``"your-domain.*"``,endpoint=~``"${location}"``}))
quantile(``0.90``, (job:nginx_request_latency_seconds_v2:avg_by_endpoint{host=~``"your-domain.*"``,endpoint=~``"${location}"``}))
quantile(``0.95``, (job:nginx_request_latency_seconds_v2:avg_by_endpoint{host=~``"your-domain.*"``,endpoint=~``"${location}"``}))
Business Error
The business error code is not a system error, it commonly caused by some user's abnormal operation encounter the edge case of business logic. However, the client should handle these edge cases in advance to improve user's experience. If some kind of business error amount is too much, we should confirm whether there is a bug or can we optimize it. So it's helpful to monitor the business errors.
Panic Error
Panic always means there is a bug. Businesses should always try to recover from the panic to avoid instance quitting, but the panic still impacts the business, and some panic cannot be recovered. So we should fix the panic issue asap.
(sum(increase(studio_fclp_panic_total{service=~``"${serviceName}"``}[5m])) by (cid) or ` ` 0``) +

(sum(increase(server_recovery_total{service=~``"${serviceName}"``}[5m])) by (cid) or ` ` 0``) +

(sum(increase(panic_total{ervice=~``"${serviceName}"``}[5m])) by (cid) or ` ` 0``)
Summary
| Indicator | Brief | Standard | Need Rules | Need To Be In Report | Remark |
|---|---|---|---|---|---|
| HTTP Code Status: 5xx | 5xx number increases means there is something wrong with the service availability | < 10 per min | Yes | Yes | For api-gateway upstream services, use api-gateway layer metric. For other web services, use SGW layer metrics. |
| Business Error | Business error is reasonable, but pay attention on the high rate business error, it maybe means there are some serious bugs | > 80% | Yes | No | Alerts: use the wave ratio instead of fixed value |
| CCU | For websocket service, use ws established connections. For HTTP service, use regular heartbeat api qps to calculate CCU | - | Yes | Yes | For retention game, use fixed value or change rate of CCU as alert rules. For campaign game, can use some other metrics instead of CCU to monitor service status |
| API Latency | Game is a latency sensitive business, low api latency means high user experience | P50 < 20ms | Yes | Yes | Same as above |
| Panic Error | Panic always means a bug, that needs to fix | 0 | Yes | No | - |
| Play Time Success Rate | The business core function should keep high available, it's the core function | > 99% | Yes | Yes | Same as above |
| HTTP Code Status: 4xx | We should pay attention on 401 and 403 HTTP status code to avoid some serious bugs | < 50% per api | Yes | No | Same as above |