How To Setup Monitoring & Observability In Your Server


This post will covering up on how to setting up observability metrics in a server. This will include some resource also like mySQL, Redis and RabbitMQ
Why Monitoring and Observability Important
Monitoring and observability are crucial for maintaining the health, performance, and reliability of your Windows server and its applications. This metrics provide insights into the behavior of the systems, and give the end user a lot of benefit like:
- Detect and diagnose issues: Quickly identify the root cause of problems, reducing downtime and minimizing impact on users.
- Optimize performance: Pinpoint bottlenecks and areas for improvement, enhancing efficiency and resource utilization.
- Proactively prevent failures: Identify trends and patterns that could lead to future issues, enabling to take preventative measures.
Prometheus Installation
Linux
Installation step for setting up prometheus in linux based server
#!/bin/bash

# Set the Prometheus version
PROMETHEUS_VERSION="2.37.6"

# Download Prometheus
wget https://github.com/prometheus/prometheus/releases/download/v$PROMETHEUS_VERSION/prometheus-$PROMETHEUS_VERSION.linux-amd64.tar.gz

# Extract the downloaded archive
tar xvfz prometheus-$PROMETHEUS_VERSION.linux-amd64.tar.gz

# Remove the downloaded archive to save space
rm prometheus-$PROMETHEUS_VERSION.linux-amd64.tar.gz

# Create necessary directories
sudo mkdir -p /etc/prometheus /var/lib/prometheus

# Move Prometheus binaries
cd prometheus-$PROMETHEUS_VERSION.linux-amd64
sudo mv prometheus promtool /usr/local/bin/

# Move configuration files
sudo mv prometheus.yml /etc/prometheus/prometheus.yml
sudo mv consoles/ console_libraries/ /etc/prometheus/

# Clean up
cd ..
rm -rf prometheus-$PROMETHEUS_VERSION.linux-amd64

# Verify installation
prometheus --version

# Set up Prometheus as a service
echo "[Unit]
Description=Prometheus
Wants=network-online.target
After=network-online.target

[Service]
User=root
ExecStart=/usr/local/bin/prometheus \\
  --config.file=/etc/prometheus/prometheus.yml \\
  --storage.tsdb.path=/var/lib/prometheus \\
  --storage.tsdb.retention.time=7d\\
  --web.console.templates=/etc/prometheus/consoles \\
  --web.console.libraries=/etc/prometheus/console_libraries

[Install]
WantedBy=multi-user.target" | sudo tee /etc/systemd/system/prometheus.service

# Reload systemd to apply the new service
sudo systemctl daemon-reload

# Start and enable Prometheus service
sudo systemctl start prometheus
sudo systemctl enable prometheus

# Check Prometheus status
sudo systemctl status prometheus
Windows
For windows server, it much easier than linux. we just need to install the binary file (available in github) and then the prometheus is ready to send metrics
Installation
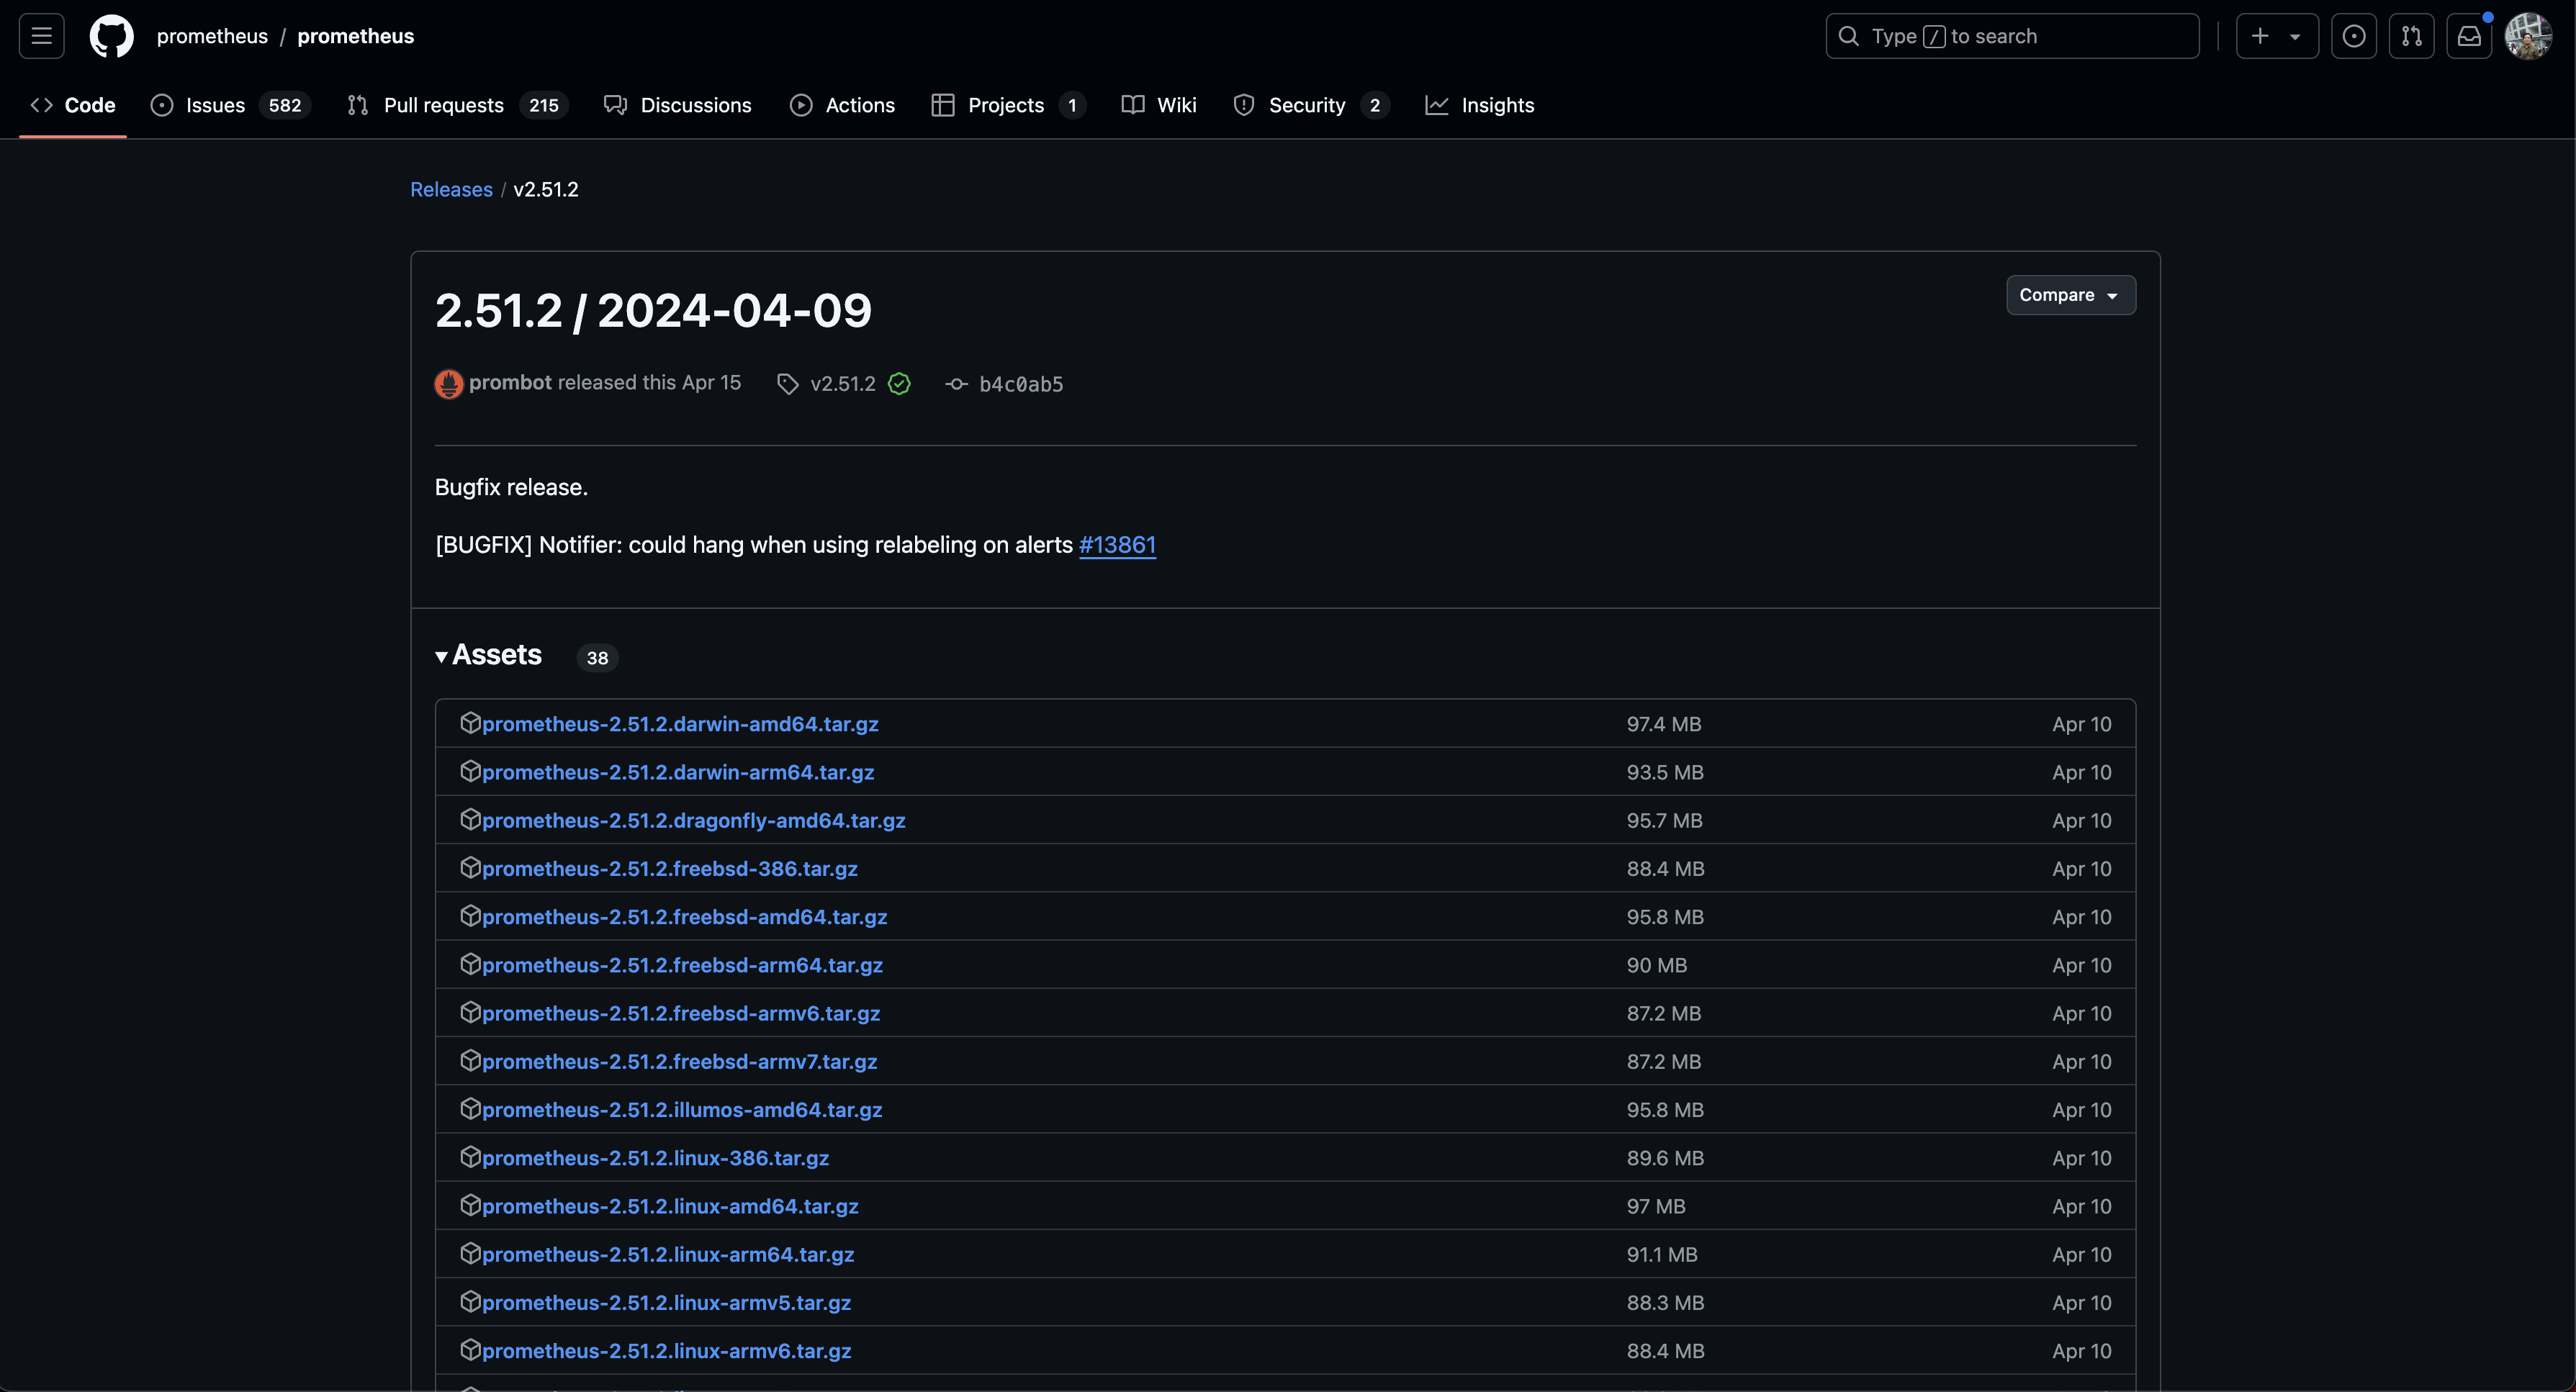
Visit the official prometheus github to download the build file for windows
Configure Startup
After the extraction finish. we just can navigate to folder and proceed the installation by using this command
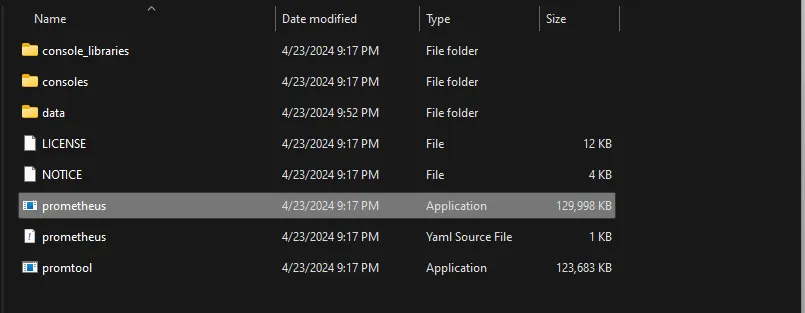
.\prometheus.exe — config.file prometheus.yml — web.listen-address “:9090” — storage.tsdb.path
Or we can use task scheduler to do that. just open the task scheduler and create new task with this data:
startup command: C:\prometheus-2.51.2.windows-amd64\prometheus.exe --config.file=C:\prometheus-2.51.2.windows-amd64\prometheus.yml --storage.tsdb.retention.time=3d
Prometheus will ready afterward
Configure task Collection
Task collection is a way to group multiple scrape configurations together to collect metrics from multiple targets. A task collection is defined in the Prometheus configuration file using the scrape_config section. Here is an example of a task collection:
# my global config
global:
  scrape_interval: 15s # Set the scrape interval to every 15 seconds. Default is every 1 minute.
  evaluation_interval: 15s # Evaluate rules every 15 seconds. The default is every 1 minute.
  # scrape_timeout is set to the global default (10s).

# Alertmanager configuration
alerting:
  alertmanagers:
    - static_configs:
        - targets:
          # - alertmanager:9093

# Load rules once and periodically evaluate them according to the global 'evaluation_interval'.
rule_files:
  # - "first_rules.yml"
  # - "second_rules.yml"

# A scrape configuration containing exactly one endpoint to scrape:
# Here it's Prometheus itself.
scrape_configs:
  # The job name is added as a label `job=<job_name>` to any timeseries scraped from this config.
  - job_name: "prometheus"

    # metrics_path defaults to '/metrics'
    # scheme defaults to 'http'.

    static_configs:
      - targets: ["localhost:9090"]

  - job_name: "windows-exporter"
    static_configs:
      - targets: ["localhost:9182"]
        labels:
          role: test

  - job_name: "mysql-exporter"
    static_configs:
      - targets: ["localhost:9104"]
        labels:
          role: test

  - job_name: "rabbitmq-exporter"
    static_configs:
      - targets: ["localhost:9419"]
        labels:
          role: test

  - job_name: "redis-exporter"
    static_configs:
      - targets: ["localhost:9121"]
        labels:
          role: test
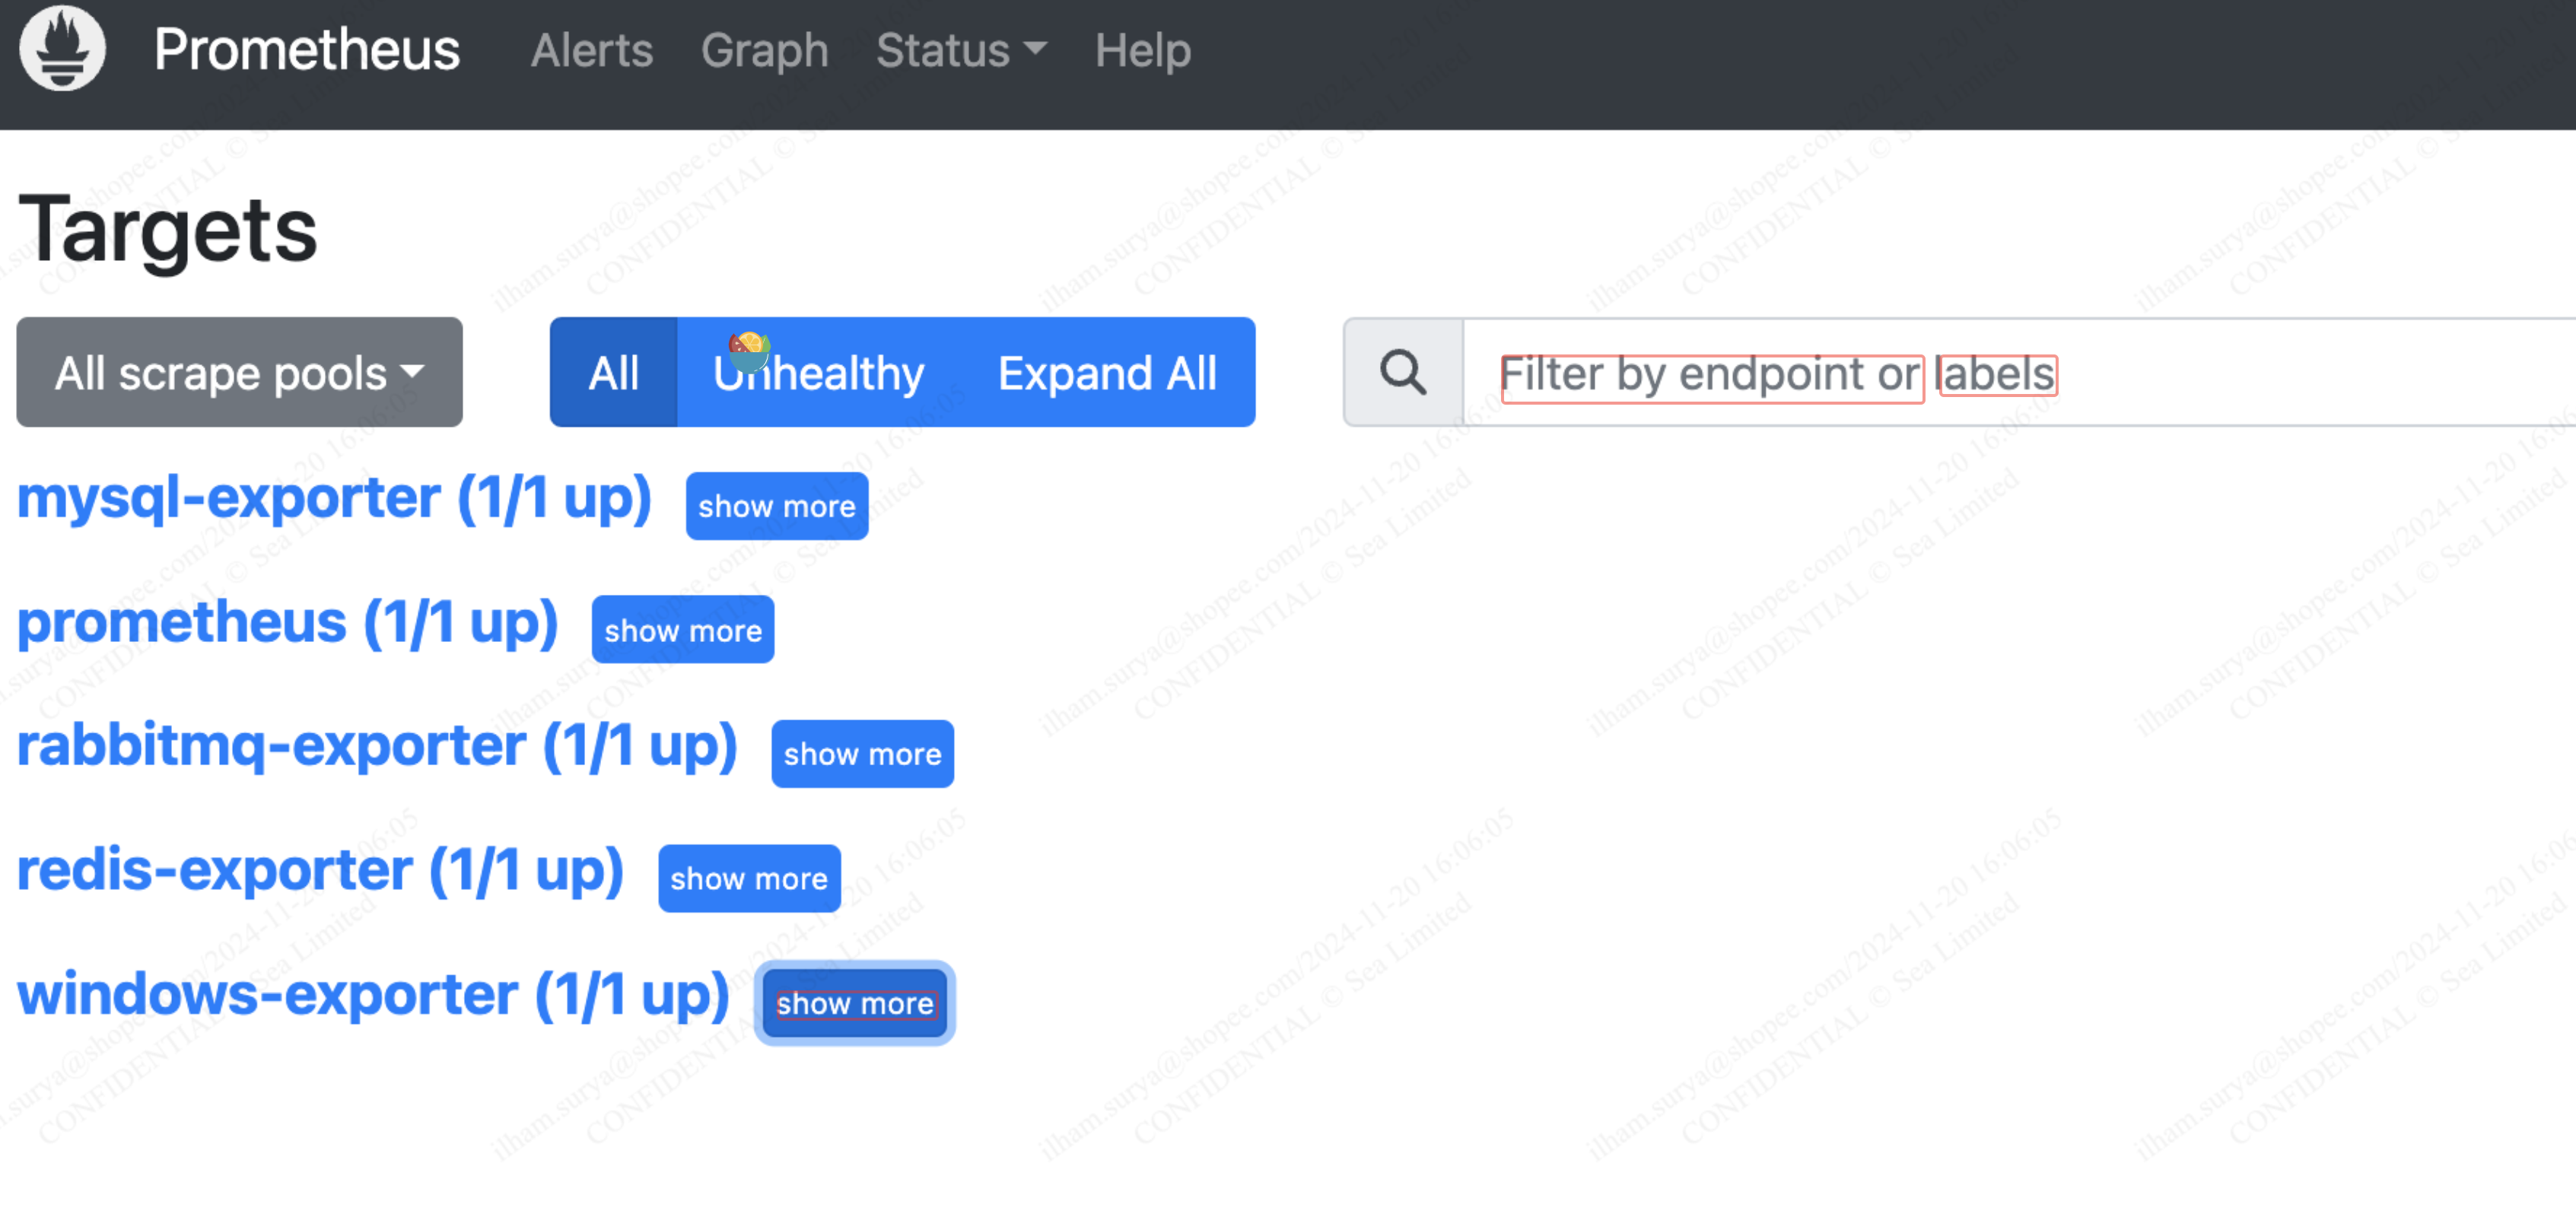
After the scrape job is finish. The prometheus interface will updated like this:
SQL Server Exporter Installation
1. Installation SQL Server Exporter (Windows)
https://github.com/burningalchemist/sql_exporter/releases/tag/0.16.0
md D:\Exporter\sql_exporter && curl -L https://github.com/burningalchemist/sql_exporter/releases/download/0.16.0/sql_exporter-0.16.0.windows-amd64.zip -o D:\Exporter\sql_exporter\sql_exporter-0.16.0.windows-amd64.zip
2. Create configuration file
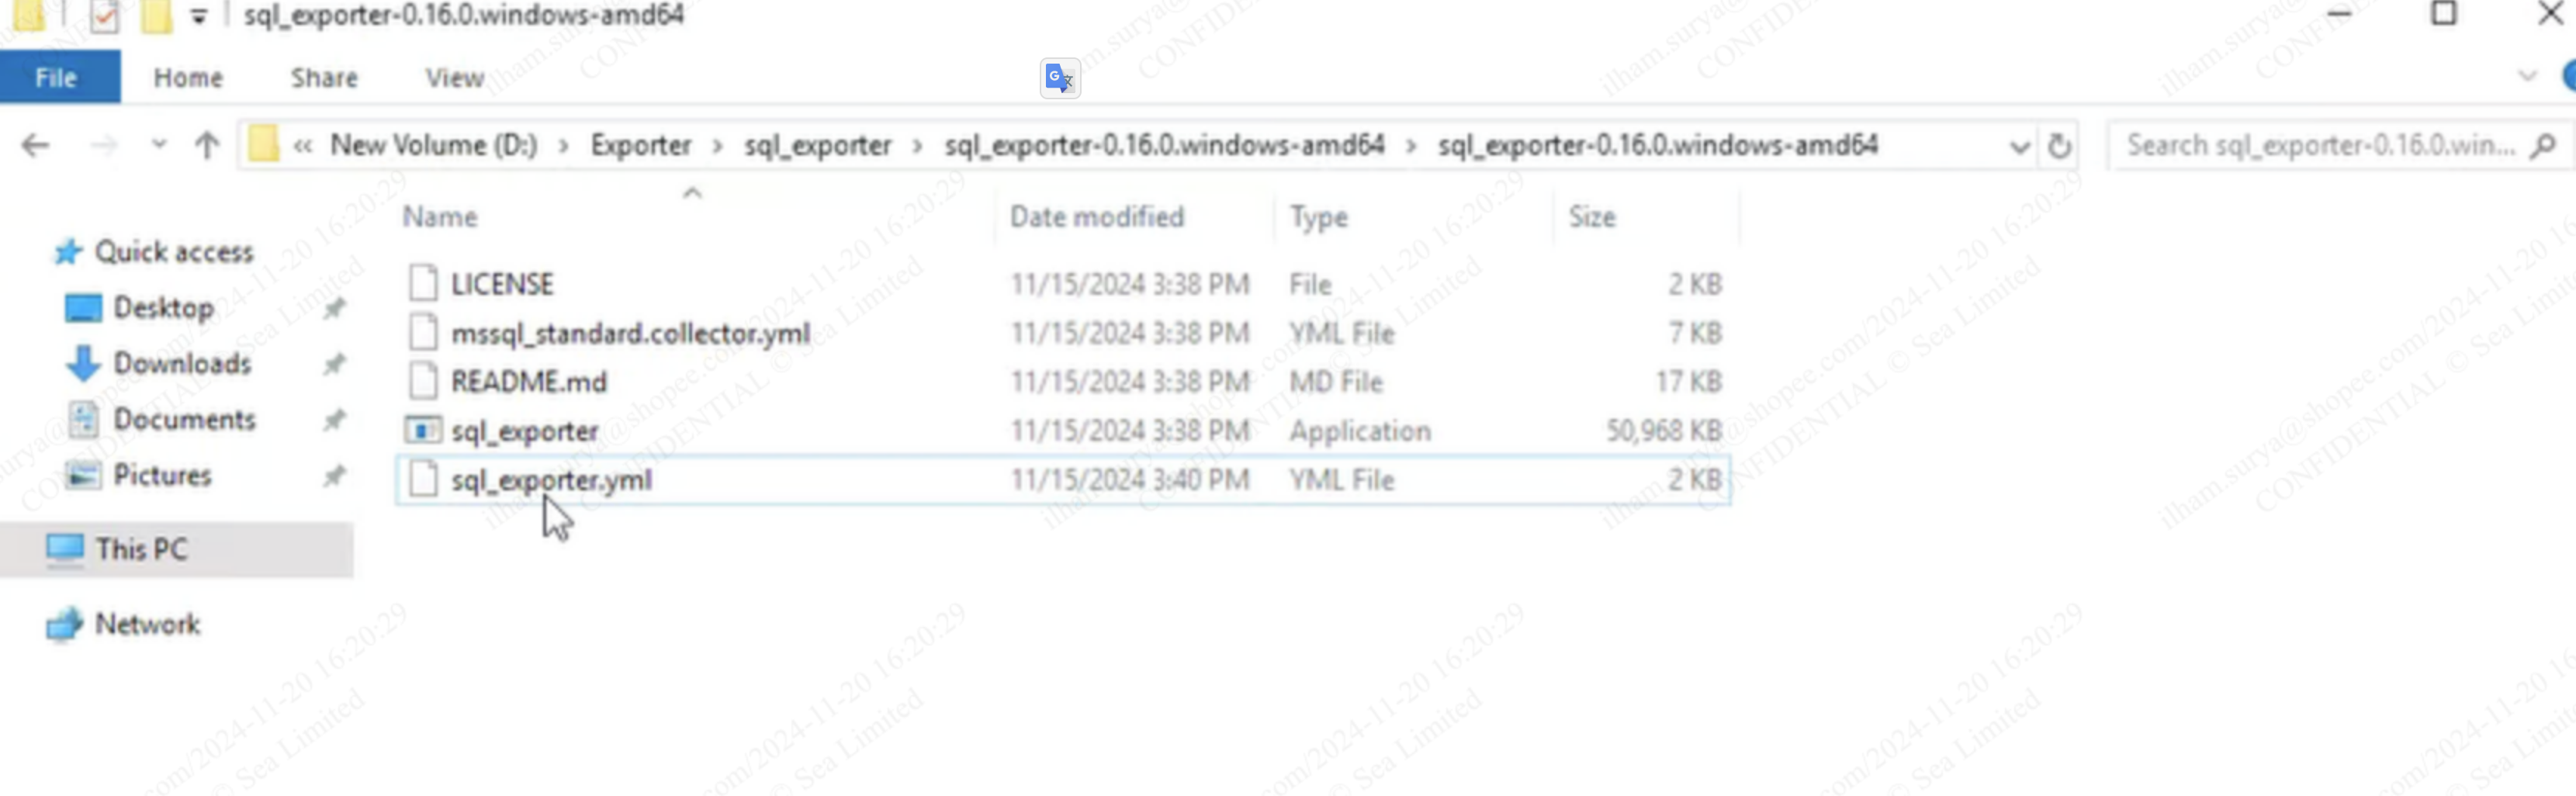
Modify the sql_exporter.yml file and change it to the correct account password
# Global defaults.
global:
  # If scrape_timeout <= 0, no timeout is set unless Prometheus provides one. The default is 10s.
  scrape_timeout: 10s
  # Subtracted from Prometheus' scrape_timeout to give us some headroom and prevent Prometheus from timing out first.
  scrape_timeout_offset: 500ms
  # Minimum interval between collector runs: by default (0s) collectors are executed on every scrape.
  min_interval: 0s
  # Maximum number of open connections to any one target. Metric queries will run concurrently on multiple connections,
  # as will concurrent scrapes.
  max_connections: 3
  # Maximum number of idle connections to any one target. Unless you use very long collection intervals, this should
  # always be the same as max_connections.
  max_idle_connections: 3
  # Maximum number of maximum amount of time a connection may be reused. Expired connections may be closed lazily before reuse.
  # If 0, connections are not closed due to a connection's age.
  max_connection_lifetime: 5m

# The target to monitor and the collectors to execute on it.
target:
  # Data source name always has a URI schema that matches the driver name. In some cases (e.g. MySQL)
  # the schema gets dropped or replaced to match the driver expected DSN format.
  data_source_name: "sqlserver://prom_user:[email protected]:1433"

  # Collectors (referenced by name) to execute on the target.
  # Glob patterns are supported (see <https://pkg.go.dev/path/filepath#Match> for syntax).
  collectors: [mssql_*]

# Collector files specifies a list of globs. One collector definition is read from each matching file.
# Glob patterns are supported (see <https://pkg.go.dev/path/filepath#Match> for syntax).
collector_files:
  - "*.collector.yml"
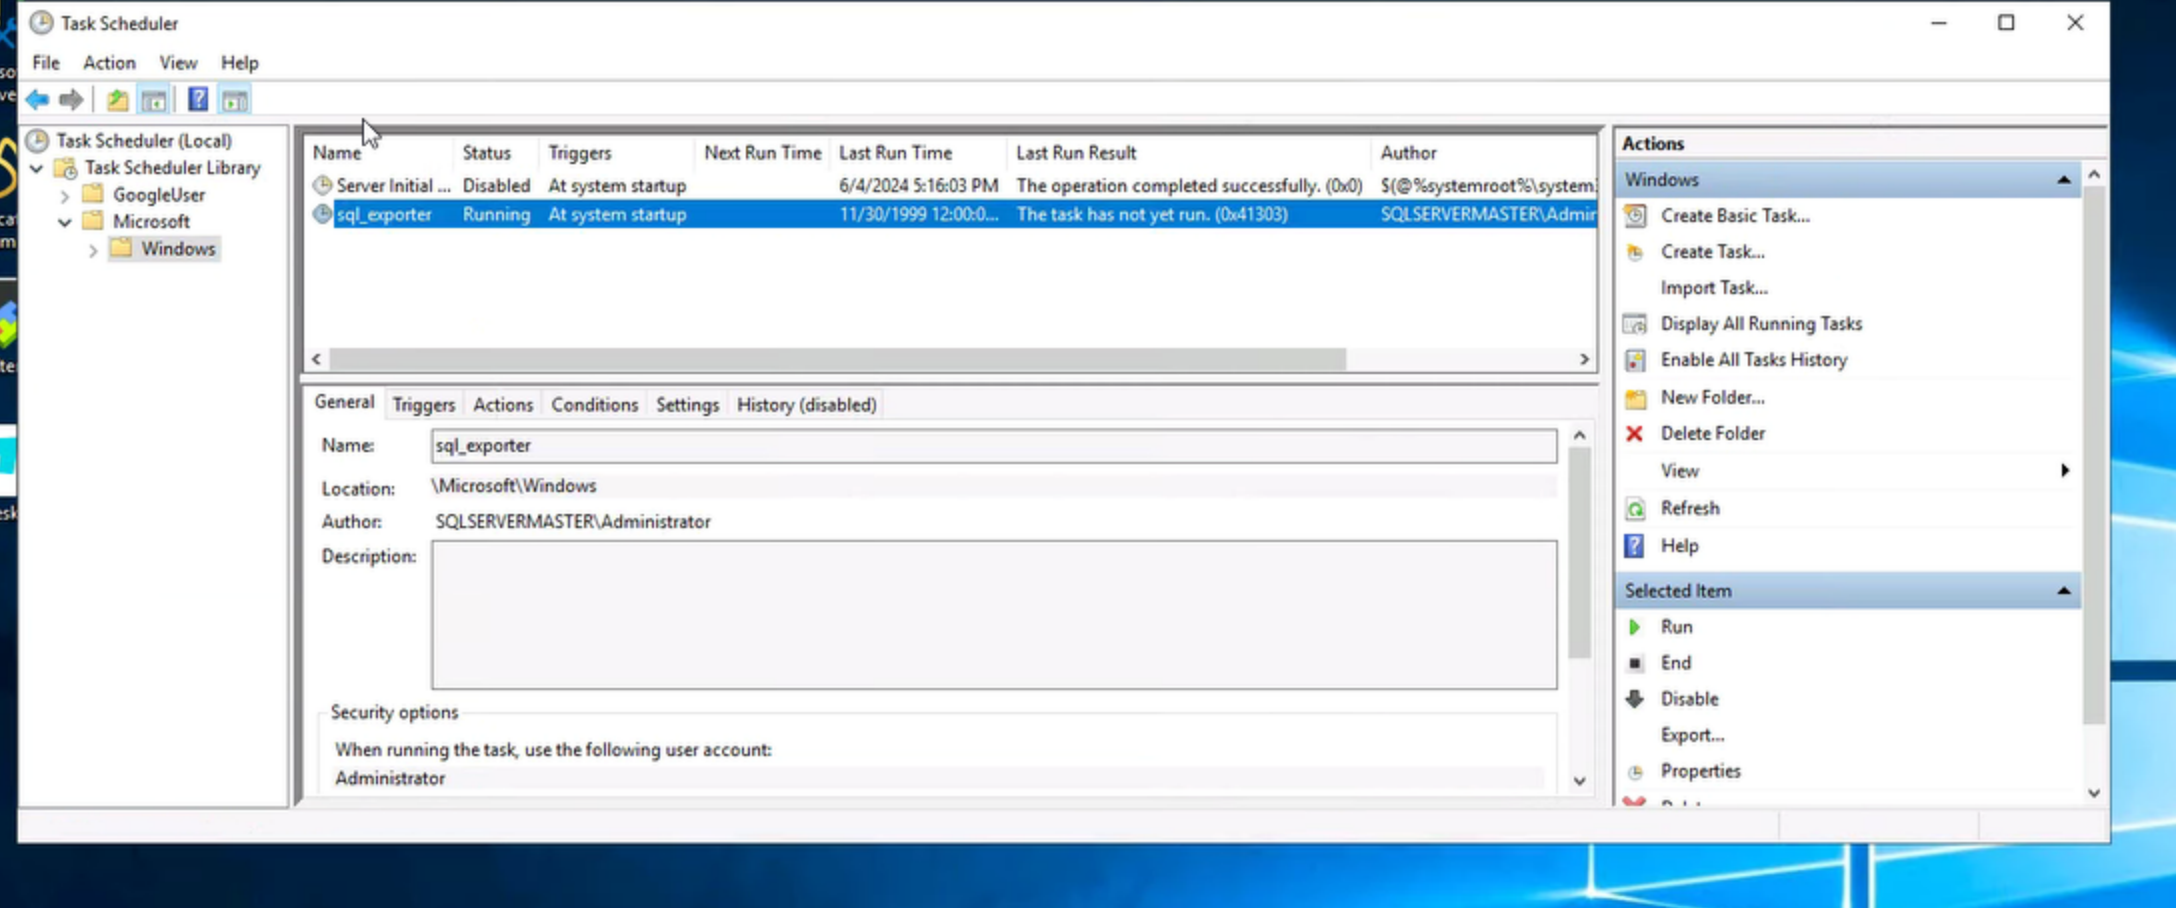
3. Configure Startup
For windows, we can use task startup like prometheus to automate the exporter
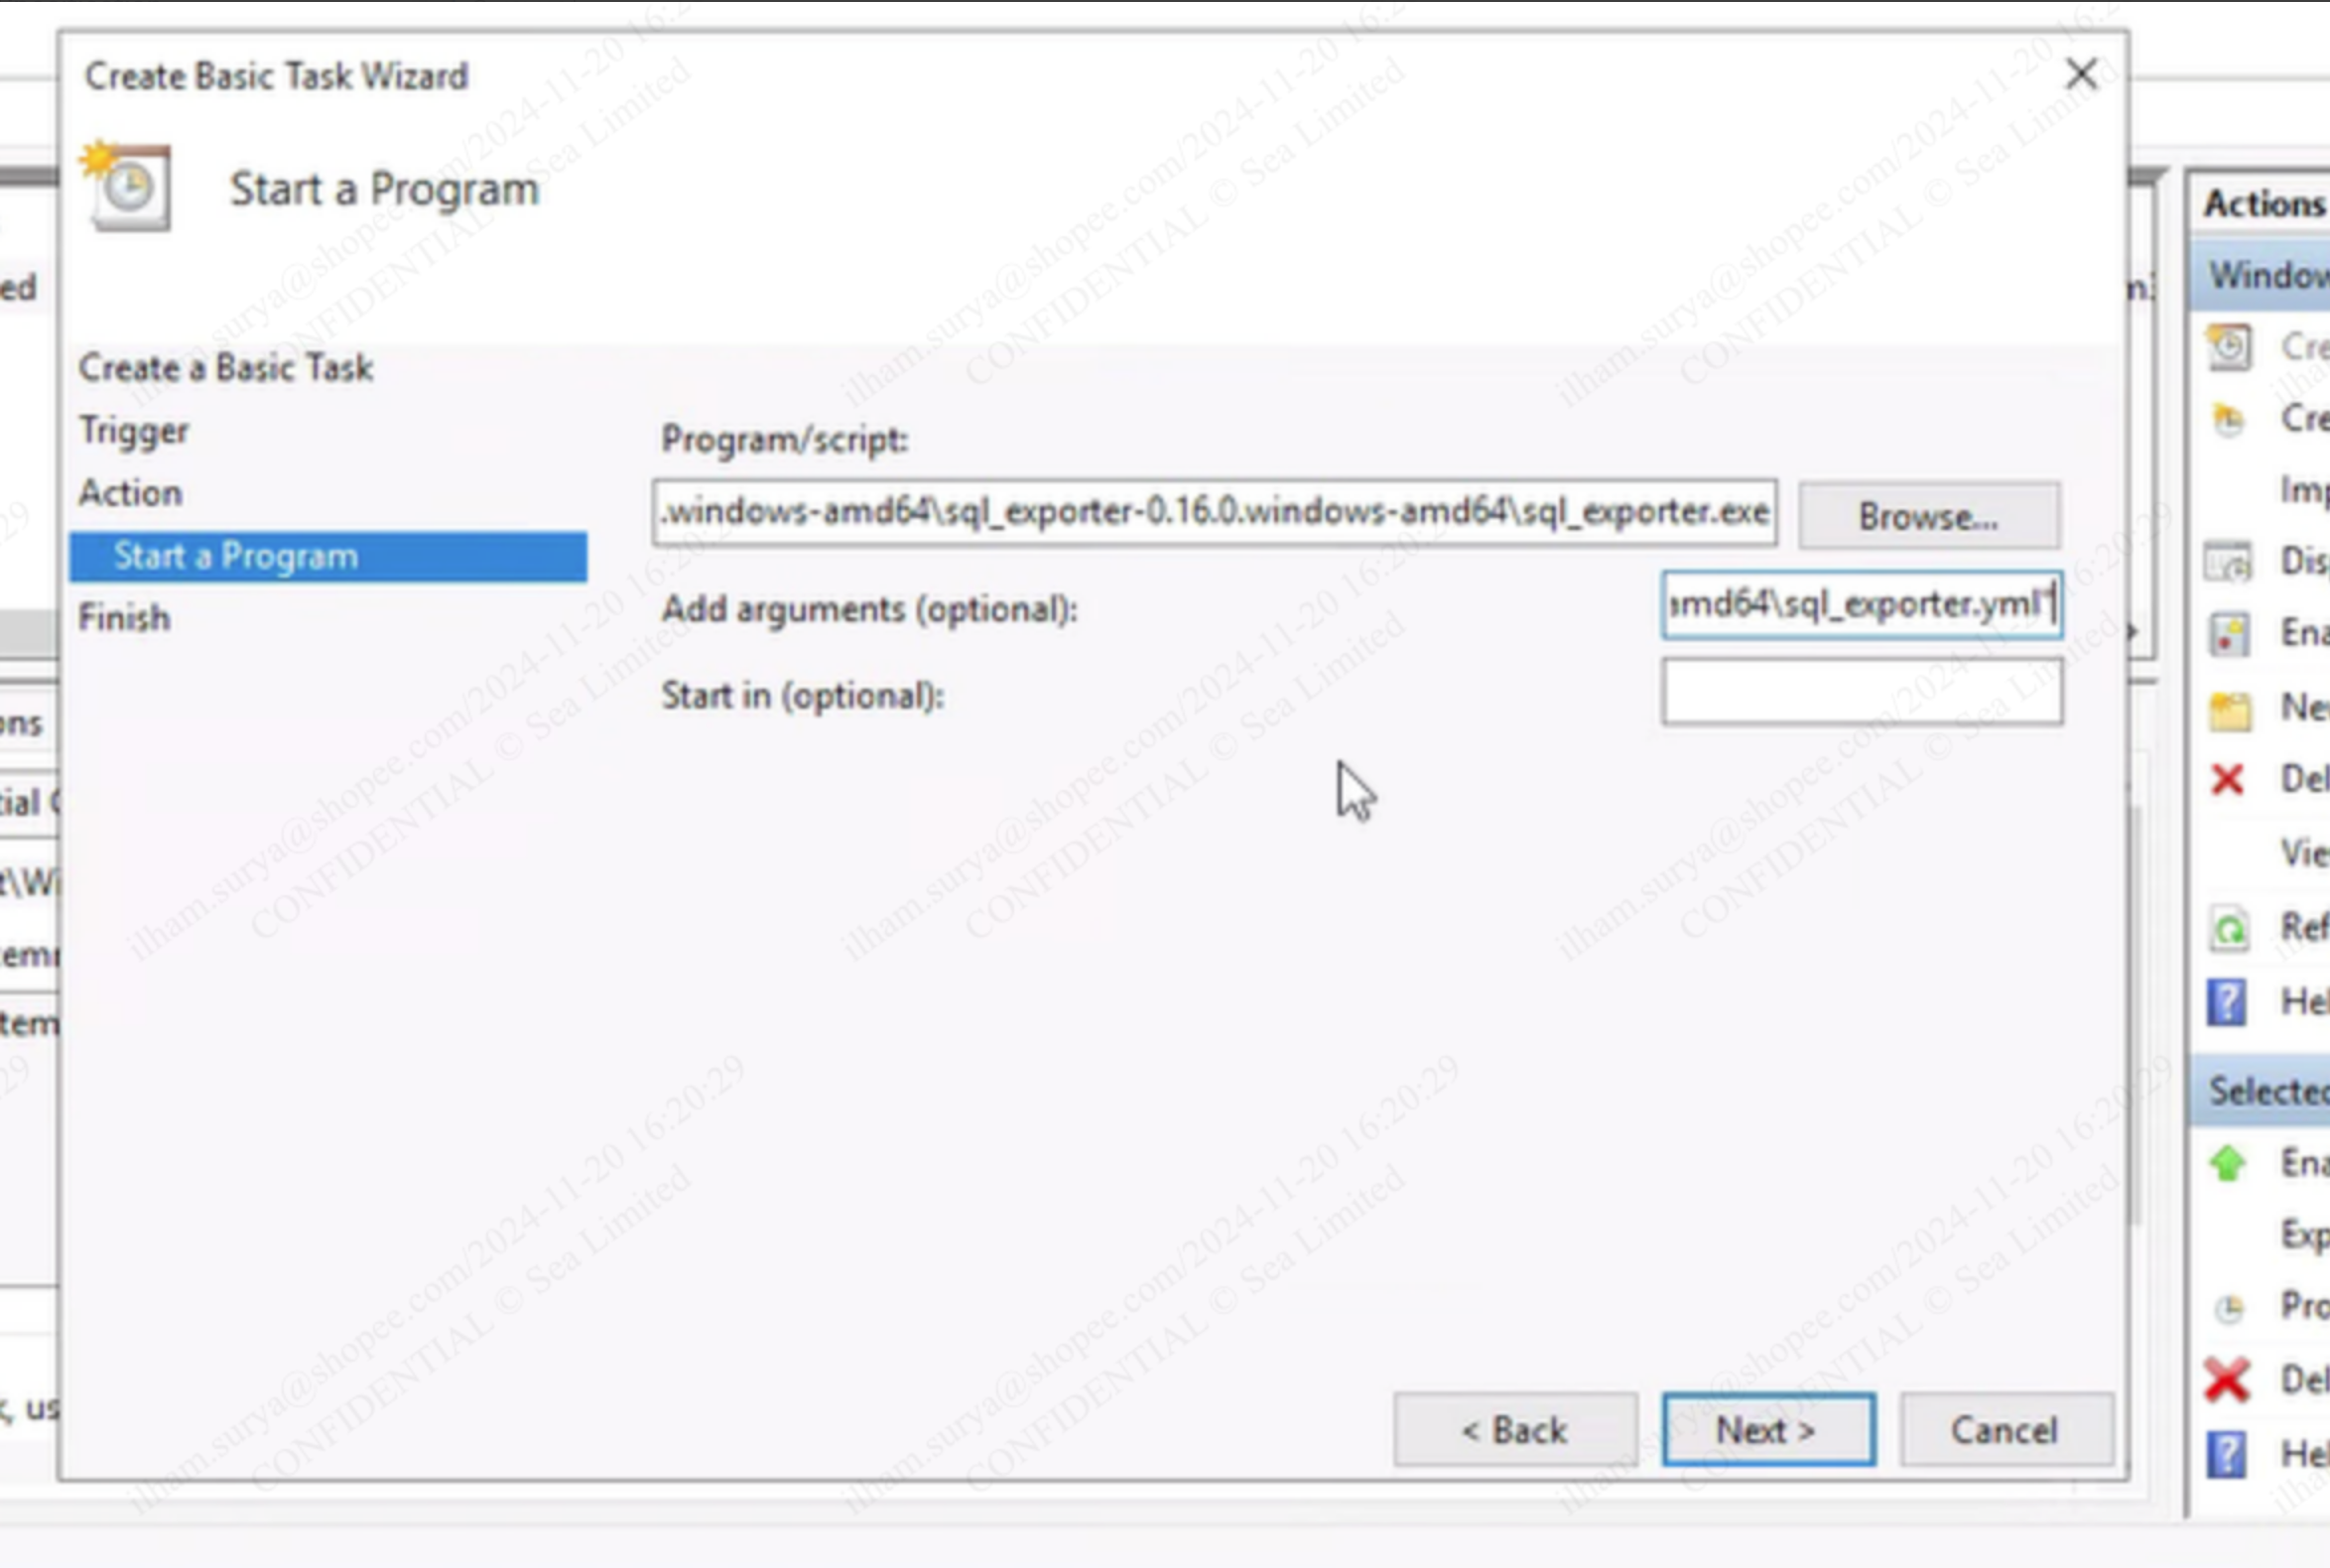
Task Startup Command:D:\\Exporter\\sql_exporter\\sql_exporter-0.16.0.windows-amd64\\sql_exporter-0.16.0.windows-amd64\\sql_exporter.exe --config.file="D:\\Exporter\\sql_exporter\\sql_exporter-0.16.0.windows-amd64\\sql_exporter-0.16.0.windows-amd64\\sql_exporter.yml"
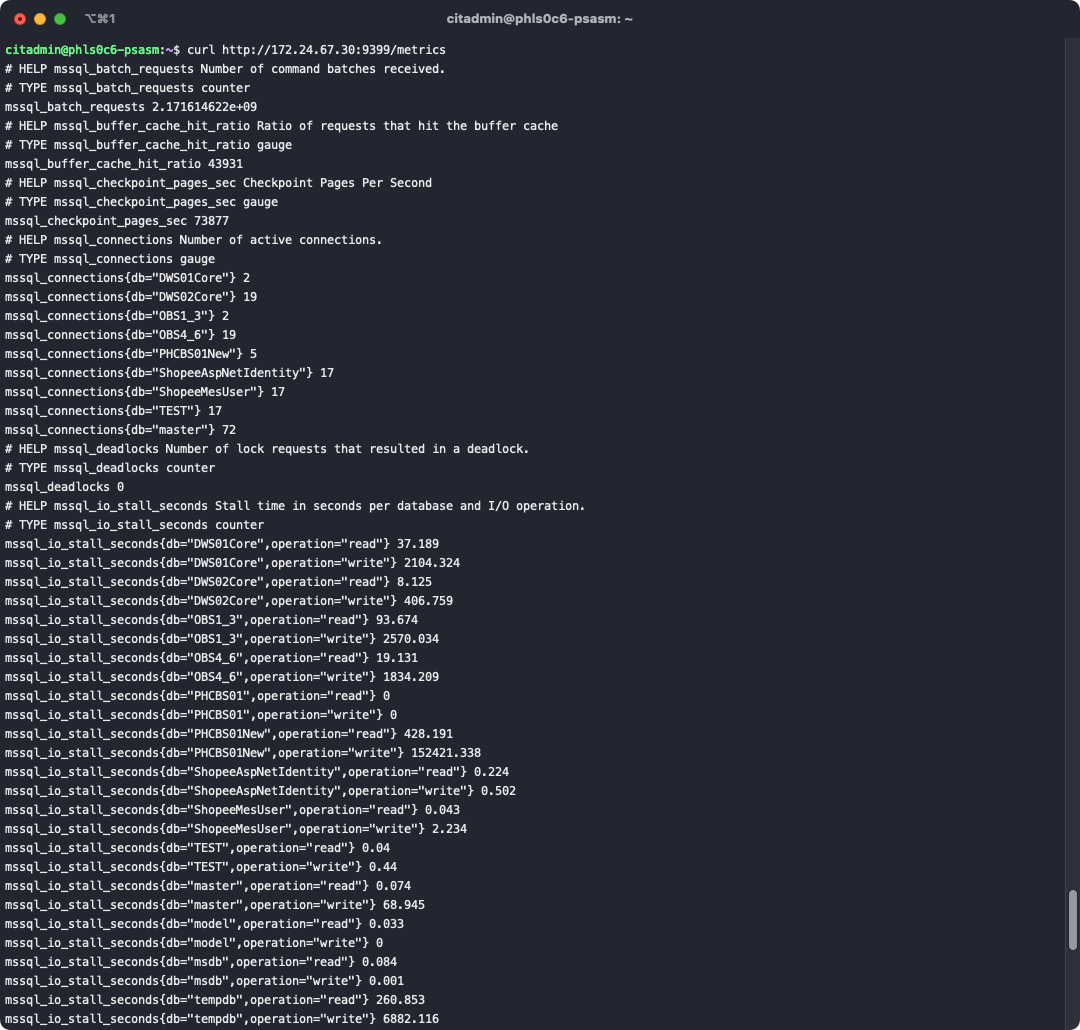
4. Verify the installation
Metrics can be seen in this path localhost:9339/metrics
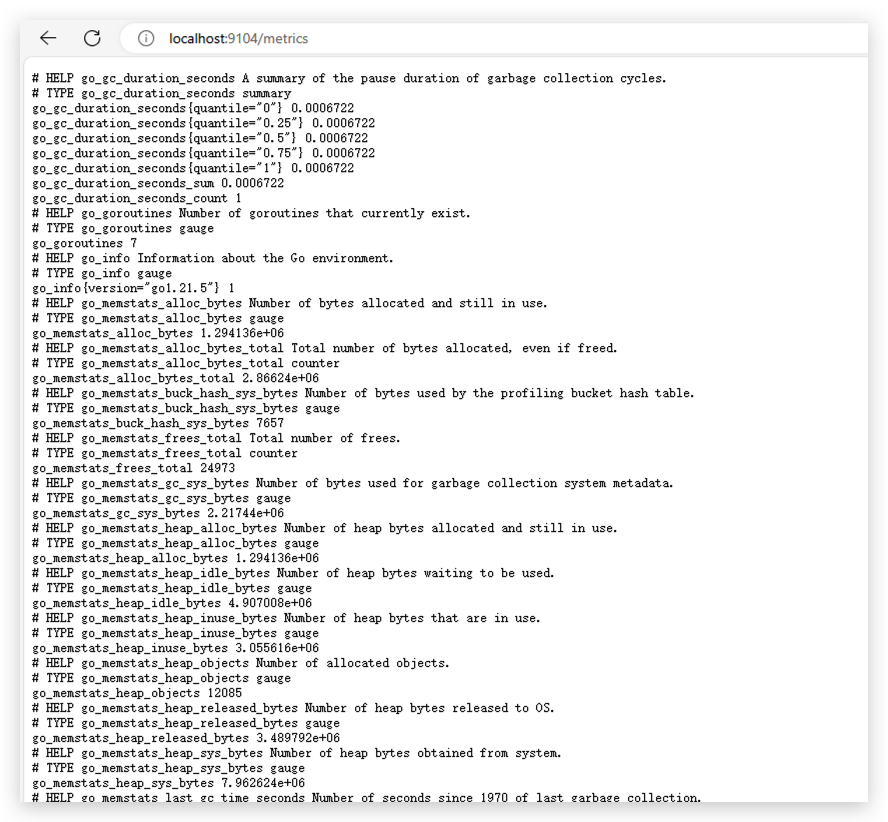
MySQL Exporter Installation
1. Installation My SQL Exporter (Windows)
First, is download the binary from official repo in github https://github.com/prometheus/mysqld_exporter/releases/tag/v0.15.1
2. Configuration File My SQL Exporter (Windows)
Start the program and create a configuration file my.cnf
[client]
user=root
password=123456
host=127.0.0.1
port=3306
3. Configure Startup File My SQL Exporter (Windows)
Same as SQL Server, create new task scheduler with this params:
Test startup command: C:\\mysqld_exporter-0.15.1.windows-amd64\\mysqld_exporter.exe --config.my-cnf=C:\\mysqld_exporter-0.15.1.windows-amd64\\my.cnf
4. Verify Installation
localhost:9104/metrics
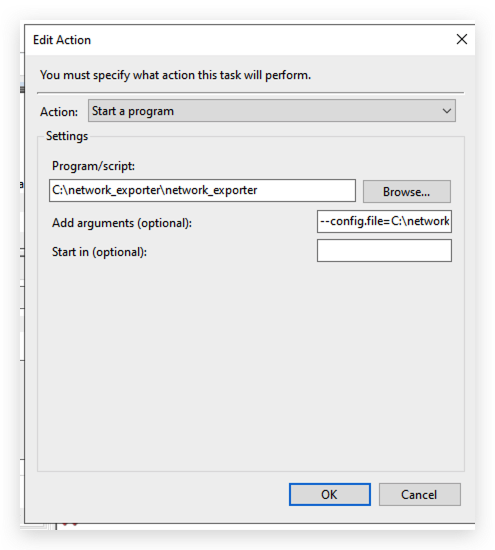
Network Exporter Installation
1. Installation Network Exporter (Windows)
First, download and install the binary
https://github.com/syepes/network_exporter/releases/tag/1.7.7
2. Configure Task Scheduler
Test startup command: C:\network_exporter\network_exporter --config.file=C:\network_exporter\network_exporter.yml
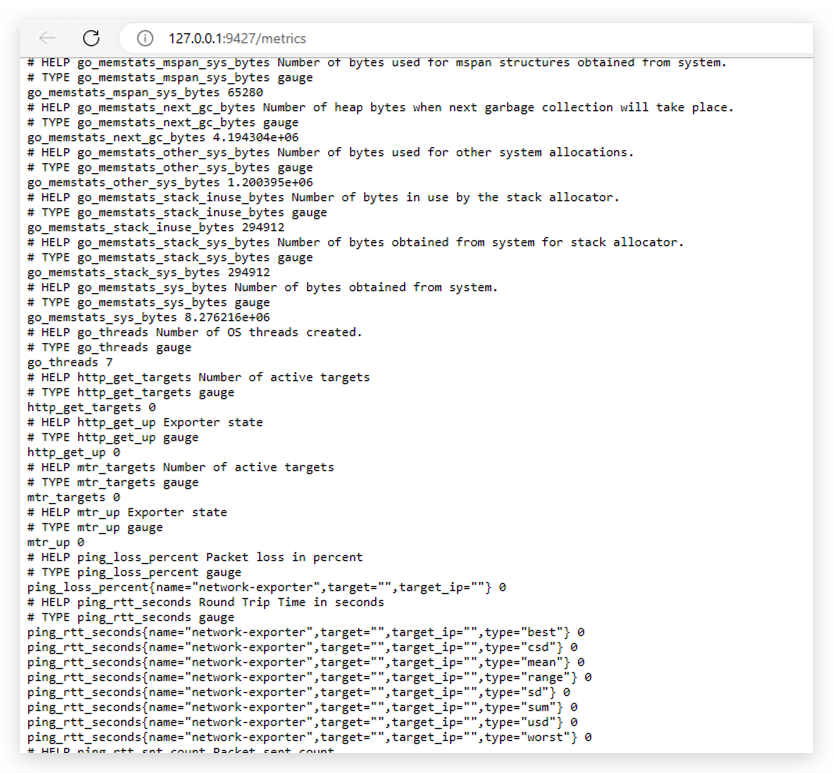
3. Run the test
After restarting, run the test http://127.0.0.1:9427/metrics
RabbitMQ Exporter Installation
1. Installation RabbitMQ Exporter (Windows)
https://github.com/kbudde/rabbitmq_exporter/releases
2. Configuration File
Create a new configuration file rabbitmq_exporter.conf
{
    "rabbit_url": "http://127.0.0.1:15672",
    "rabbit_user": "guest",
    "rabbit_pass": "guest",
    "publish_port": "9419",
    "timeout": 30,
    "max_queues": 0
}
3. Setup Task Scheduler
Setting up the task scheduler like previous exporter
Test startup command: C:\rabbitmq_exporter\rabbitmq_exporter.exe --config-file "C:\rabbitmq_exporter\rabbitmq_exporter.conf"
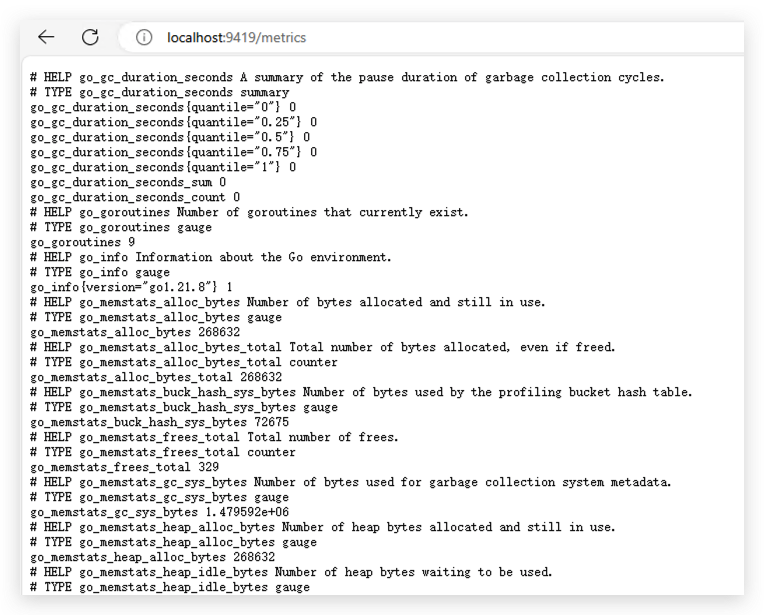
4 Verify Installation
After restarting, run the test http://localhost:9419/metrics
Redis Exporter Installation
1. Install Redis Exporter
Install from official github
https://github.com/oliver006/redis_exporter/releases/tag/v1.59.0
2. Configure Task Scheduler
Test startup command: C:\redis_exporter-v1.59.0.windows-amd64\redis_exporter.exe -redis.addr 127.0.0.1:6379 -redis.password test
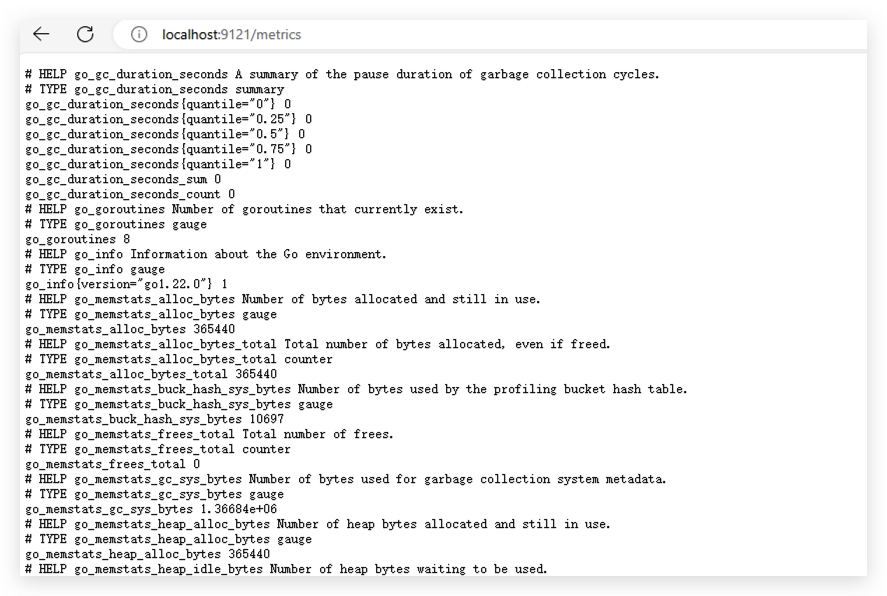
3. Verify Installation Redis Exporter
After restarting, run the test http://localhost:9121/metrics
Conclusion
Setting up comprehensive monitoring and observability for your server infrastructure, including critical resources like MySQL, Redis, and RabbitMQ, is not just a best practice—it's a necessity for maintaining a healthy, performant, and reliable system. This approach shifts from reactive problem-solving to proactive issue mitigation, allowing you to anticipate and address potential problems before they impact the endusers.
Key takeaways and why this matters
Early issue detection
Observability provides the deep insights needed to quickly identify and diagnose issues, minimizing downtime and preventing costly outages. This translates directly to improved user experience and business continuity.
Performance optimization
By monitoring key metrics, you can pinpoint bottlenecks and optimize resource utilization, ensuring your applications run efficiently and your infrastructure operates at peak performance.
Proactive prevention
Observability helps you identify trends and patterns that might indicate future problems, empowering you to take preventative action and avoid potential disruptions.
Data-driven decisions
The metrics you collect provide valuable data that informs capacity planning, resource allocation, and other strategic decisions, leading to a more efficient and cost-effective IT infrastructure.
Enhanced security
Monitoring can reveal unusual activity that might indicate a security breach, allowing for faster response and mitigation of security threats.
In today's complex IT landscape, where downtime can be incredibly costly, investing in robust monitoring and observability is essential. By implementing the strategies and tools outlined in this post, we can gain the visibility and control needed to ensure the stability, performance, and security of your Windows server environment and its vital applications.