Troubleshooting Guideline


This post i will try to setting up a guideline outlines a structured, methodical approach to troubleshooting performance issues in containerized or server-based environments. It emphasizes a hypothesis-driven process, guided by key performance metrics, to accurately diagnose and resolve problems.
The importance of systematic troubleshooting on issue
A systematic troubleshooting approach like this is crucial for several reasons:
- Efficiency: By focusing on metrics and hypotheses, we will avoid random guessing and wasted effort. The structured process helps you pinpoint the root cause faster.
- Accuracy: Metrics provide objective data, leading to more accurate diagnoses and preventing misinterpretations of the problem.
- Reproducibility: The documented steps make the troubleshooting process reproducible, allowing others to understand and replicate the analysis.
- Learning and Improvement: By analyzing metrics and validating hypotheses, we will gain a deeper understanding of system behavior and improve our troubleshooting skills over time.
- Minimizing Downtime: Rapid and accurate troubleshooting reduces downtime and minimizes the impact of performance issues on users or services.
1. CPU Perfomance
A. Average Load
The load average represents the average number of processes waiting for CPU time over a given period (1, 5, and 15 minutes). A high load average indicates CPU contention.
1.1 Checking the Load Average
To check the load average, we can use the uptime command or the top command. The definition of the average load is the average number of running or non-interruptable processes.
Key Takeaways
- to check if the number of running/non-interruptable processes exceeds the number of CPUs.
If so then your processes might not be executed directly. - We could also see that if the 5min average load is really high then it is possible to have a super intensive process running 5 minutes ago.
1.2 Identifying CPU-Intensive Utilization
To check the utilization, we can use command like top, htop, vmstat, mpstat to Shows the percentage of CPU time spent in different states (user, system, idle, iowait, etc.). High user+system utilization suggests CPU-bound performance issues.
B. CPU Context Switch
Background KnowledgeRelated to the above topic where the system average load increased due to the competition of the CPU among many processes.
One of the main reasons why the system average load increase is because of the context switch.
Let's discuss more the definition of the context switch.
2.1 What is Context Switch?
Context switch is a process where the CPU switches from one task to another task. Frequent context switches indicate that the CPU is rapidly switching between different processes. Excessively high context switching can be a sign of too many processes competing for CPU time or inefficient scheduling.
2.2 How Does Context Switch Work?
CPU needs to know where the task is loaded and its context; therefore CPU got the PC and **Register.
PC is the location where the instruction will be called and **Register** is a small portion of fast access memory built inside the CPU to store the context of the CPU that will be run.
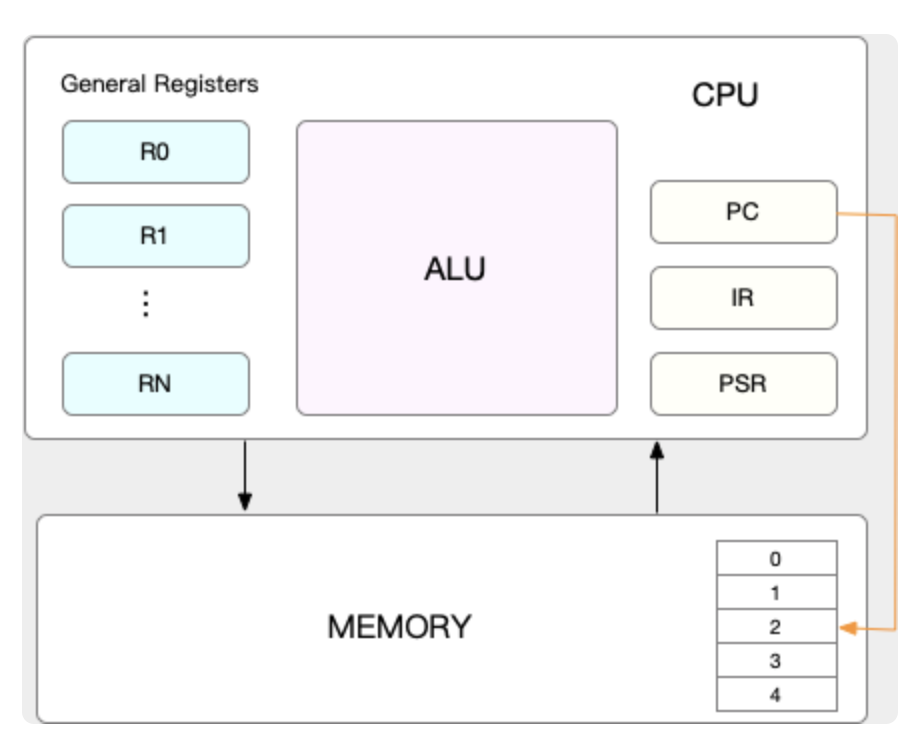
When the CPU decided to switch the task, the current PC and Register data will be stored inside the system memory kernel.
which will be reloaded later when we switch back the task.
The context switch itself is divided into 3 types of context switches.
1. process context switch
Understanding User Space and Kernel Space:
- User Space: Where regular applications run. Processes in user space have restricted access to system resources (memory, hardware, etc.) for security and stability.
- Kernel Space: The core of the operating system. It has full access to all hardware and system resources. The kernel manages processes, memory, devices, and other system-level operations.
System Calls: The Bridge Between User and Kernel Space
When a user-space process needs to perform an operation that requires kernel privileges (e.g., reading from a file, sending data over the network, allocating memory), it makes a system call. In order to understand this, we need to understand how the process is being executed by the CPU.
so all the processes that we usually know are executed in the user space where it can access a limited number of resources, whenever a user process wants to interact with the hardware they need to do a system call, where this system call is processed in the **kernel space.**So the way the system call works are the original user instruction from the CPU register is saved and replaced by the kernel instruction.
Then after the system called finished the user instruction is swapped back.
In short the step is like this:
- Trap: The user process issues a special instruction (a software interrupt or trap) that signals the CPU to switch to kernel mode.
- Save User State: The CPU saves the current state of the user process (register values, program counter, etc.) onto the kernel stack.
- Execute Kernel Code: The CPU jumps to the appropriate kernel function to handle the system call.
- Restore User State: After the system call completes, the CPU restores the saved user process state from the kernel stack.
- Return to User Space: The CPU switches back to user mode, and the user process resumes execution.
1. Process context switch, Why do I explain the system call?
A process context switch is similar to a system call in that it involves a transition to kernel space. However, it's a more complex operation because it involves switching between different processes, not just between user and kernel mode within the same process. Because the process context switch happened in the kernel space, so it is similar to the system call but it does more than the system call.
Workflow of process context switch
- Trigger: A context switch can be triggered by various events, including:
- Time slice expiration: The scheduler decides to switch to another process to ensure fair CPU allocation.
- Higher priority process becomes ready: A process with a higher priority than the currently running process becomes runnable.
- I/O operation completion: A process waiting for an I/O operation to complete becomes runnable.
- Save Current Process State (Both User and Kernel):
- User-level context: Register values, program counter, stack pointer, memory mappings (virtual memory), open files, etc. are saved.
- Kernel-level context: Kernel stack, kernel registers, and other kernel-specific data are saved.
- Load Next Process State: The context (both user and kernel) of the next process to run is loaded from its saved state.
- Resume Execution: The CPU resumes execution in the new process.
First, when we do the process context switch we save our user instruction, user virtual memory, stacks, and a global variable to the kernel memory. Then we go to the kernel space where we save the kernel stack, and register as well. Then we swap with the next process user resources and kernel resources.
Key Differences Between System Calls and Context Switches:
| Feature | System Call | Context Switch |
|---|---|---|
| Purpose | Request kernel service | Switch between different processes |
| Scope | Within a single process | Between different processes |
| State Saved | User-level context | Both user-level and kernel-level context |
| Trigger | Explicit request by the user process | Scheduler, I/O, higher priority process |
Why Context Switching Matters:
Context switching has performance implications. Saving and loading process states consumes CPU time and memory bandwidth. Excessive context switching can reduce overall system throughput. Therefore, minimizing unnecessary context switches is important for optimal system performance. This is often achieved through proper process and thread management, efficient I/O operations, and appropriate scheduling algorithms.
2. Thread Context Switch
The best definition of thread is the basic unit of scheduling in contrast with a process where it is the **basic unit of resource.
**when we do the thread context switch it can be owned by the same process or different.
What happens during a thread context switch?
-
Save Thread State: The current thread's registers (including the program counter, stack pointer), and sometimes thread-local storage (TLS), are saved. The kernel stack of the thread may also be saved, but the memory space and other resources of the process remain unchanged.
-
Load Next Thread State: The register values and other saved state of the next thread to run (within the same process or a different one) are loaded.
-
Resume Execution: The CPU resumes execution within the new thread.
Why is thread context switching faster than process context switching?
- Shared Memory: Threads within a process share the same virtual memory space. This means there's no need to switch memory mappings (page tables) during a thread context switch, a significant time saver.
- Fewer Resources to Manage: Fewer resources need to be saved and restored compared to process context switching because threads share resources.
3. Interrupt Context Switching:
Interrupt context switching is fundamentally different from process or thread context switching. It's triggered by hardware interrupts, not by the operating system scheduler.
Summary
| Feature | Process Context Switch | Thread Context Switch | Interrupt Context Switch | |
|---|---|---|---|---|
| Trigger | Scheduler, I/O | Scheduler | Hardware Interrupt | |
| State Saved | Full (user & kernel) | Minimal (registers, TLS) | Minimal (PC, registers) | |
| Speed | Slowest | Faster | Fastest | |
| Memory Space | Switch | Shared | N/A | |
| Resource Sharing | None | Shared | N/A |
Tools To Use for CPU-Related problem
- Load Average:
- uptime: Displays the current time, system uptime, and load average for the past 1, 5, and 15 minutes.
- w: Similar to uptime, but also shows currently logged-in users and what they are doing.
- top (or htop): The load average is displayed in the top section of the output.
- CPU Utilization:
- top (or htop): Dynamically displays CPU utilization per core and overall. Press 1 in top to show per-core statistics.
- vmstat 1: Shows various system statistics, including CPU utilization. The 1 argument tells vmstat to update every second.
- mpstat -P ALL 1: Displays per-CPU utilization statistics. The -P ALL option shows statistics for all CPUs. The 1 argument updates every second.
- pidstat -u 1: Shows per-process CPU utilization. The -u flag specifies CPU usage statistics, and 1 updates the display every second.
- Context Switches:
- vmstat 1: The cs (context switches) column shows the number of context switches per second.
- pidstat -w 1: Shows per-process context switch statistics (voluntary and involuntary context switches). The -w flag selects context switch stats, and the 1 sets a 1 second interval.
- IOWait:
- iostat -x 1: Displays detailed I/O statistics, including IOWait (%iowait). The -x option shows extended statistics, and 1 specifies a 1-second interval.
- vmstat 1: The wa column (I/O wait) represents the percentage of time spent waiting for I/O.
- top (or htop): IOWait is usually shown as wa in the CPU utilization summary.
Memory Performance
A. Basic Memory Management
In order for the operating system to be able to manage various processes where the memory requirement far exceeds the physical capability of the RAM.
OS needs to have a clever way to do the memory management for each process.
How this clever way works,
so whenever we fork a new process, an independent virtual addresses space is created, therefore, the actual address space being created will far exceed the physical limitation of the memory itself.
If we have the virtual address space then technically a map that could help to associate the virtual address to its physical location is needed.
This map is what we call a page table, a page indicating the basic memory unit in Operating System so we don't go with the absolute number like 1Kb/1Mb.
Each page could be associated with a certain size that you could check on your machine.
The next question is where this page table is stored,
the page table is stored at the MMU which is the physical hardware inside the CPU and this page table is also cached at TLB.
so the flow of accessing the memory of a process is as follows:
- First, check the page table from TLB.
- If not found from TLB, the page table will be fetched from the MMU.
- Find the physical location from the page table.
- If the page is not presented inside the memory, trigger the major page fault.
What if the memory is full
Since processes use more memory than the actual physical space, so what would be the mechanism when the memory is almost full?
- Memory will be reclaimed based on a certain algorithm such as LRU.
- Write the most infrequent access page table to the swap partition. This swap partition is located in the disk.
- Kill the process that causes OOM.
How the OS decided which PID to kill when OOM happened,
the answer depends on the oom_adj value of the PID. The value range from -17 to 15, the less the value the less likely it would be killed by the OOM.
echo -17 > /proc/PID/oom_adj .
Many important daemons like rsyslog, sshd are set with a really low number of oom_adj hence it is less likely to be killed.
Tools
- free
This tool is really great to understand the system-level availability- available means the free + buff/cache.
- Now you might wonder what is the definition of buff/cache, lets continue this in the next section.
B. What is buff/cache
In order to understand buffer and cache, we should look into the man page.
Does man free give u an answer. seems not.
but it gives you a hint that the free only looks into the `proc/meminfo` to read the data from,
so let's take a look of man proc
Ok, so now we seem to get a clear understanding of the definition of buffer and cache.
- Buffer is used to buffering the data written before it got flushed to the disk.
- A cache is used to help cache the page for reading purposes.
However, this is not entirely true, let's do a simple experiment to write data to the file.
The data that keeps increasing is the cache when we tried to write a file, definitely, this is not aligned with the definition of the buffer above.
When we tried to write the data to the disk directly, seems it increased the buff. Though this is aligned with the definition from proc but the cache definition is not aligned with the man page.
Summary for writing:
- Write to the filesystem using the cache
- Write to disk using buffer
Now let's do another round of experiments for reading purposes.
Summary for reading:
- read to the filesystem using the cache
- read to disk using buffer
Final conclusion
- read/write to the filesystem will use cache
- read/write to disk will use a buffer.
C. Monitor the cache hit rate
Firstly, the goal of the application should be to increase the hit cache rate, so we do not need to access the disk so often.
Tools
-
General cache stats can use
cachestat- For the detail of each column, we could check the man page as usual.
- However, the misses and hits definitions are pretty literal.
-
Check the PID of the highest hit-and-miss cache. Please use the
cachetop -
Note that though the cache hit is 100% it does not mean that the application use fully the cache to read/write the file.
because if the application read the disk directly which bypasses the cache then we cannot see the miss percentage here.
D. How to Detect the memory leak
Memory leak definition is when the heap allocation of the process keeps growing and cannot be reclaimed due to the object referenced.
Tools
vmstat
Please monitor whether the free memory keeps decreasing.
If so then it is one sign of the memory leak happening.memleakanother tool from the bcc to check particular functions keeps allocating memory(heap)
E. Memory reclamation and Swap
only 2 parts of memory can be reclaimed when the system needs more memory.
- File pages.
- The file page is the page that we stored inside the cache when we read/write the filesystem.
Note a keyword filesystem here.
- The file page is the page that we stored inside the cache when we read/write the filesystem.
- Anonymous pages
- This is a memory page that is not backed by any filesystem, which is assigned on the fly when there is a heap allocation.
The reclamation process is really straightforward, if the free memory is below the low threshold then the reclamation process will be started.
This low threshold depends on a formula calculated from the following value /proc/sys/vm/min_free_kbytes .
To check the real low value you could check /proc/zoneinfo
Tools
-
sar -r -S 1The kbactive indicates the memory that is actively being used
the kbinact indicates the memory that will most likely be reclaimed -
You could pay attention to the changes of the
/proc/zoneinfoas well.
Technically when the free number is below the low, the reclamation process will be started and will bump the value of the free back.
F. Summary General Guidance
- First use the
toporfreeto check general memory usage. - Check the
vmstatto observe the trend over time. - Do the cache/buffer analysis, memory allocation, and memory usage per process.
- If the cache keeps increasing meaning that there is a running process that writes huge amounts of data to memory.
- We can use the
sarcommand for this.
- We can use the
- The reclamation can be from the anonymous page which will increase the swap or the file page which will cause page fault for the previous process.
- Check the memory allocation from the pmap or memleak
- If the cache keeps increasing meaning that there is a running process that writes huge amounts of data to memory.
I/O Performance
A. Basic File System in Linux
Linux file systems actually only consist of directory entries and inodes.
The directory entry is basically the name of the file where it will store the inode. The inode itself is only metadata that contains the address location, file size, etc.
The difference between the directory entry and inode can be clearly shown with the soft link and hard link,
the hard link only copies the inode to a different dentry , in contrast with the soft link which will point to another dentry instead of inode .
The I/O access itself can differ into several categories:
1. Buffered vs Unbuffered
Buffered:
The application will read from the standard library cache.
Unbuffered:
Go through the system call to read the file directly.
2. Direct vs Indirect IO
**Direct:
**Direct access to the disk without accessing the page cache.
**Indirect:
**Access to the page cache first, then will be flushed out after hit certain threshold.
3. Block vs Non-Block IO
**Block:
**Blocking the thread until the response is retrieved.
**Non-Blocking:
**Won't block the current thread and return whatever data available.
4.Sync vs Async IO
**Sync:
**Will block until all the response of IO are all completed.
**Async:
**Will not block the thread and allow context switch with other thread, the response will only return once the complete response is retrieved.

The picture above might describe how the Linux IO stack
- The application writes the file through the VFS (virtual file system) where the client won't know whether it is network-based or block-based file system.
- The VFS then writes to the common block layer where it will help with the IO scheduling and queueing.
- Next, the common block layer will write to the device layer.
B. Basic IO Analysis
In order to observe the IO performance there are 5 key metrics to pay attention to
- Utilization → percentage of time processing IO
- Saturation → when hit 100% common block layer cannot receive the IO request to the queue anymore.
- IOPS
- Throughput
- Delay
Note that the CPU utilization can be low when the IO utilization is high because the CPU is idle while waiting for the IO.
Tools
-
iostat -xd 1- the 4 metrics of utilization, IOPS, throughput, and delay can be checked from the above iostat.
-
iotop- iotop is used to check which process uses the most IO throughput or utilization.
-
filetopto check the files written-
filetopis from the bcc tools; hence you need to install it first by executing the following commandapt-get install bcc-tools
-
-
Often times
vmstatis also used because we could observe the CPU, Memory, and the Disk IO directly. -
strace -p PIDcould also help to trace the system call that the process did. -
lsof -p PIDcould also help to trace the open file from the given PID.
C. Summary General Guidance for Disk IO problem
- Firstly check using the
topto check the wait% if the wait% is high then we should proceed to the next step. - Please check using
iostat-xd 1to check what is the bottleneck, is it throughput/delay/utilization. - Please use
pidstat -d 1it to check the process that causing the number 2 bottleneck. - You can use
filetop,lsofcommand to find which file is affected.
Network Performance
A. Basic Network Performance
In order to understand how OS processes the network packet, let's refresh our memory regarding the TCP/IP protocol.
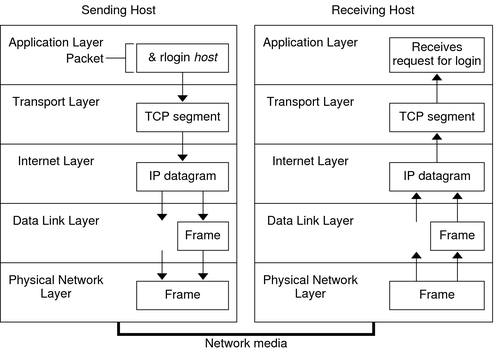
- an Application layer has a literal meaning to provide the application to the user, i.e. HTTP, FTP.
- a Transport layer provides the establishment of a connection between the client and server application; hence, a TCP segment contains the port of the application.
- an Internet layer provides routing logic and logical addressing functionality.
- a Data link layer is used for the physical addressing, error detection, and frame transmission error.
Why do we need to remember the above detail? This is because the OS works the network packet strictly following the above layers.
How to receive a packet
The network card is the physical device that connects to the network card driver in the kernel, when we receive the packet the network card will first put the packet into the
queue through DMA (Direct Memory Access ~ inside memory), then trigger the hard interrupt, where the interrupt handler will transform the packet as sk_buff and put it into another buffer. Subsequently, the soft interrupt will be triggered, where the kernel will process the sk_buff by extracting the data header from the internet layer, transport layer, and transport layer.
How to send a packet
This is exactly the reverse process, where the process will put the packet to the socket sending queue, then at each layer, a particular header is added.
TCP header that contains the port of an application is added at the transport layer.
IP header where the IP of the next location router/hop is added.
Then finally at the data link layer where the MAC address of the next hop is added.
The datagram will be fragmented according to the MTU size then the frame header and tail is added eventually. This frame will be added to the sending queue and a soft interrupt will be triggered to help
send the frame using the network interface card through the DMA.
B. Measure Network Performance
There are 4 criteria for the network performance
- PPS(packet per second)
- Throughput/Bandwidth
- Delay